Amplitude probability distribution
Proper electromyography signal processing can provide a reference for the analysis of the relationship between work and required muscular load. Jonsson (1982) described a technique in which the frequency of occurrence of a particular level of EMG is calculated, generating a curve of the probability distribution function of amplitude (APDF). The APDF is the distribution of the muscle contraction levels during a certain observation period.
The APDF concept was originally developed to extract information from EMG records of muscular activity and has been used to analyze EMG in many Ergonomics studies.
Computation
The determination of APDF allows to obtain the profile of muscle tension that workers are subject during a work period. The determination process involves the following sequence:
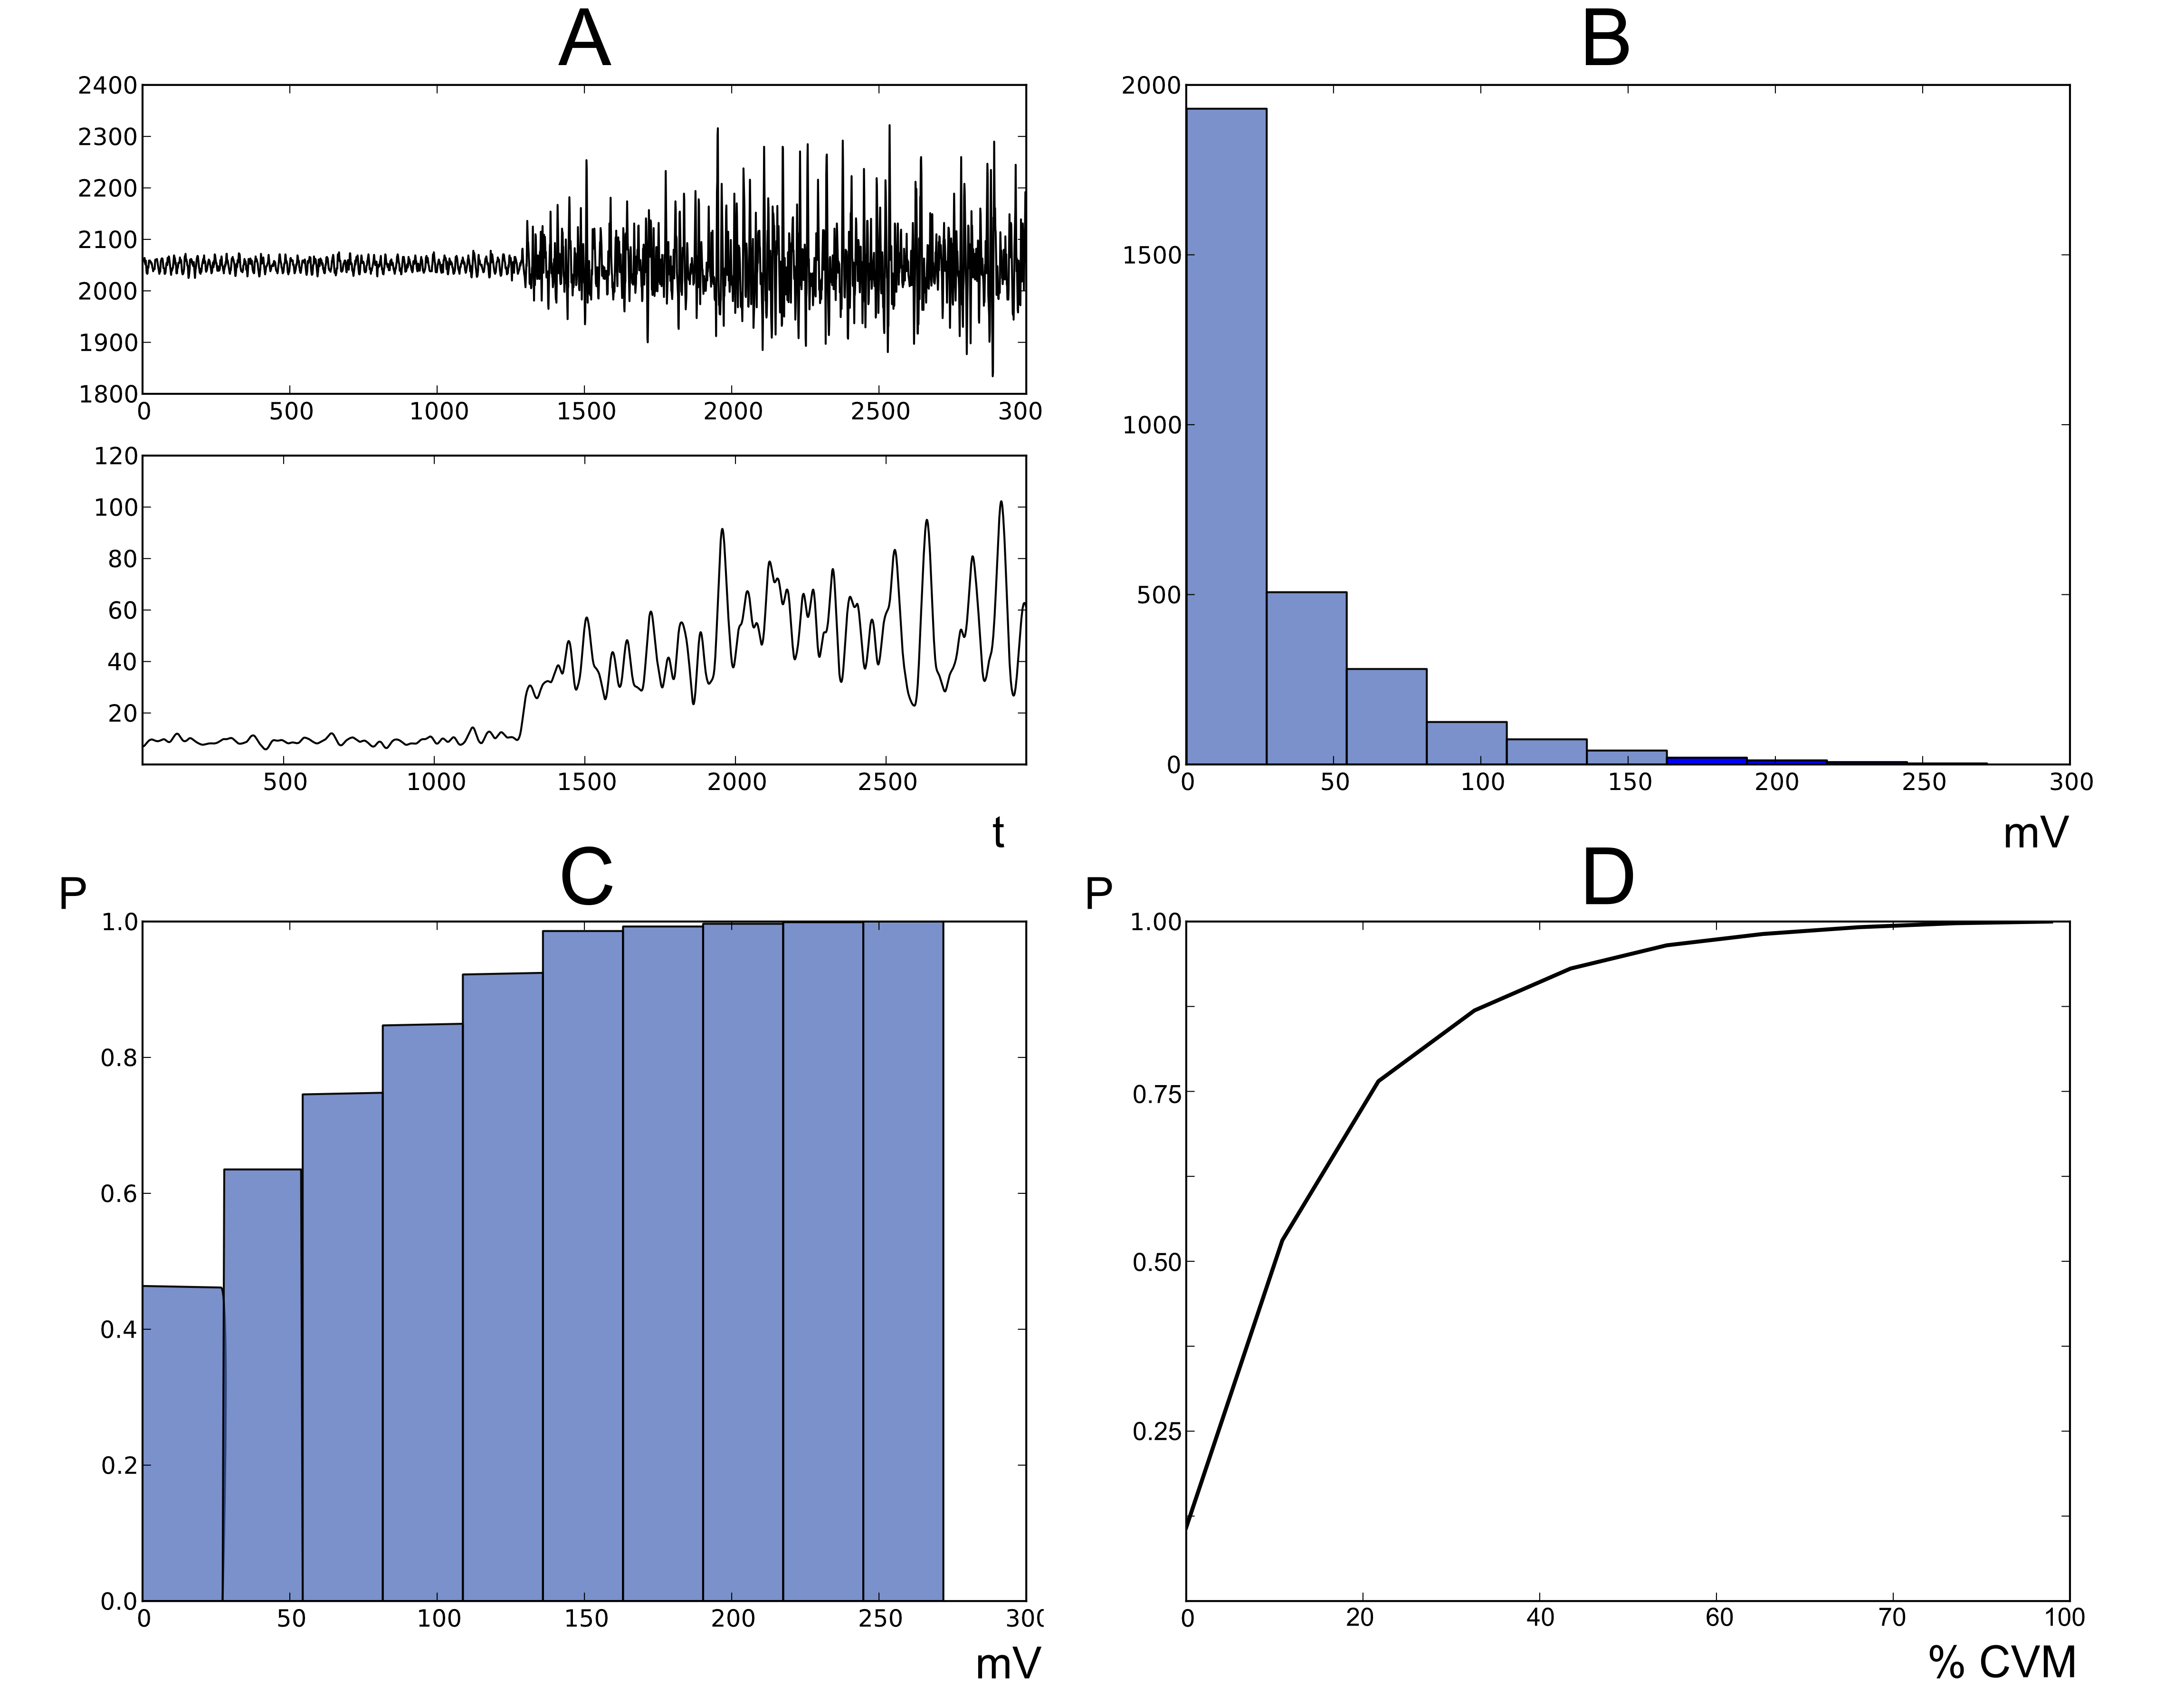
Calculation of the envelope of the EMG signal obtained by rectifying and smoothing using a low pass filter;
Determination of the histogram of the EMG signal amplitude for each muscle during the execution of the task to be studied relative to the maximum voluntary contraction (MVC) of the same muscle;
Calculation of the cumulative histogram of EMG amplitude distribution and mapping of the probability values regarding the distribution of the muscle for MVC. This way, the amplitude of EMG, as well as the probability distribution is related to the MVC, which allows comparing between several muscles or between several tasks as well as the estimation of the average APDF function groups of workers and/or tasks.
The final results of the APDF processing allows to evaluate the relative intensity of different tasks in a workstation as a whole or even the sequence realized for workers during their turn.
The amplitude probability of a certain level of contraction is the muscle’s electrical activity probability lower or equal than the level of contraction. The amplitude probability of a certain level can be expressed as the time interval where the signal is less or equal than that level. If the electromyographic activity amplitude is expressed in percentage of the MVC’s calculated value, the amplitude probability distribution is related to the contractions during the work day.
The contraction level of electromyographic signals, which has an amplitude distribution probability that initiates at a probability P=0 level, indicates the lowest contractile activity that occurred throughout the work period. This corresponds to the basal static of contraction level which is, in most of the cases, zero or quite close to zero, especially in long-term acquisitions. A typical situation of this type of contraction is the interruptions between active periods of work.
The highest contraction level of EMG amplitude distribution probability curve corresponds to a probability of P=1, indicating the highest level recorded over the work period. In cases where the highest value for muscle activity estimation might exceed 50% of the MVC, the normalization of EMG signals must be performed with a direct assessment of 100% from the MVC. Otherwise, one might establish an underestimate of APDF.
The average level of contraction associated with a probability of P=0.5 indicates the average value of the contraction developed during the work period. Usually, this average level tends to the average contraction value when obtained from the EMG integration or electromyographic signal’s RMS detection.
EMG amplitude distribution probability curve will feature how muscle behaves during study period. Each type of work presents a characteristic profile concerning the amplitude distribution probability curve.
When electromyographic records are used to obtain muscle activity levels’ evaluation, criteria must be taken into account in order to define which obtained values for muscle tension levels are acceptable and non-acceptable according to the performed occupational tasks.
According to muscle fatigue studies, when performing static and dynamic tasks, a set of limit values were suggested for the work performed over periods longer than one hour (Jonsson, 1982):
Static contraction level must not exceed 2% of the MVC and cannot overcome 5% of the MVC;
The average level must not exceed 10% of the MVC and cannot overcome 14% of the MVC;
Load’s highest values must not exceed 50% of the MVC and cannot overcome 70% of the MVC.
These limit values can be used as analysis criteria of the amplitude distribution probability curves for the relative strength in occupational tasks. One must consider the amplitude distribution probability level for an entire work day, and the limit should not be exceeded for over an hour in continuous work. If limit is exceeded, it must be exceptionally and for a 10 minutes maximum period.
These criteria can only be used for electromyographic records’ analysis of a group of workers. The individual test results within workers can exceed these limits for several reasons, such as unfavorable operational modes selection, although workers group’s overall workload is not excessive.
Use case
A study performed on automotive industry with 29 workers working in a production area of a paint factory in the automotive industry allow us to find that cervical spine and shoulder’s static contraction levels are not matter of concern in painting tasks (Carnide et al., 2006). It was also observed that, in average terms, median load is higher for fingers’ common flexor muscle and common extensor and that load peak’s level is near the acceptable limit in the muscles of the wrist and the posterior deltoid. In this study, multifactorial linear regression models were built to analyze the morphological factors influence within muscle load, allowing to bespeak that some linear and compose anthropometric characteristics might be related to a higher muscle load in shoulder and wrist’s muscles. There is an increase for muscles’ activity of upper trapezius (P50th and P90th APDF with r2=0.73 e 0.62, respectively) and posterior deltoid (P10th, 50th and 90th APDF with r2=0.99, 0.97 e 0.95, respectively) for small stature workers. On the other hand, for more mesophorm workers, anterior deltoid and fingers’ common flexors muscles are the ones with higher APDF levels. Finger’s common flexor muscle shows a negative relationship with hand length.
An important potentiality in the determination of EMG amplitude distribution probability curve lies within the possibility to measure not only the effects of plan rotations along workstations, but also the effects in break’s distribution. Total muscle work during a workday can be estimated by combining APDF analysis’ results of each different task. One can use this tasks collection to forecast the result of different combinations of rotations.